FIGURE 2.
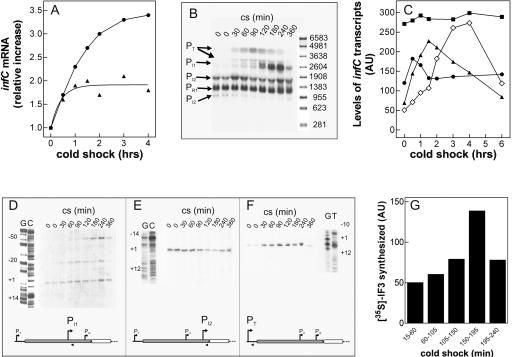
Steady-state levels of infCmRNAs and de novo synthesis of IF3 during cold adaptation. (A) Cellular steady-state levels of total infCmRNA as a function of the time elapsed after cold shock (downshift to 10°C) induced in E. coli MRE600 cultures having reached A600=0.3 (▲) and A600=1.2 (●) upon growth in LB at 37°C. The measured steady-state level at 37°C of infCmRNA in cells in the early exponential phase was between 1.4- and 1.5-fold higher than in cells in late exponential phase. The Northern blots were hybridized with a radioactive infC DNA probe (indicated by the double-headed arrow in Fig. 1) and quantified by molecular imaging. (B) Autoradiography of the Northern blot of the electrophoretically resolved infC transcripts present in the total RNA extracted at the indicated times after cold shock (10°C) from E. coli MRE600 cells stressed upon reaching A600=1.2 at 37°C in LB. The individual transcripts were identified according to their size, estimated by reference to an RNA molecular weight ladder (Sigma) run in parallel, and confirmed by primer extension analysis. (C) Variation, as a function of time of cold shock, of the steady-state levels of individual infC transcripts (▲) PT, (◇) PI1, (●) PI2, and (■) PR1 quantified by Molecular Imager and expressed as arbitrary units (AU). (D–F) Primer extension analysis of the PI1(D), PI2 (E), and PT(F) infC transcripts present in the total RNA purified from E. coli cells subjected to cold shock for the indicated times upon reaching A600 = 1.2 at 37°C in LB. The numbering to the left of each autoradiograph is given according to translational start sites identified by Wertheimer et al. (1988). The scheme below each panel represents the position of the primer (arrow head) used for the identification of the respective transcript, with respect to thrS (light gray rectangle) and infC (dark gray rectangle). Further details are given in Materials and Methods. (G) De novo synthesis of IF3 following cold shock was studied by pulse labeling for 45 min at 10°C as described in Materials and Methods. After immunoprecipitation and electrophoretic separation, the radioactivity was quantified on the dried gel by Molecular Imager. The height of each histogram bar represents the radioactivity, expressed in arbitrary units (AU), incorporated into IF3 during the indicated labeling times. Further details are given in Materials and Methods.

