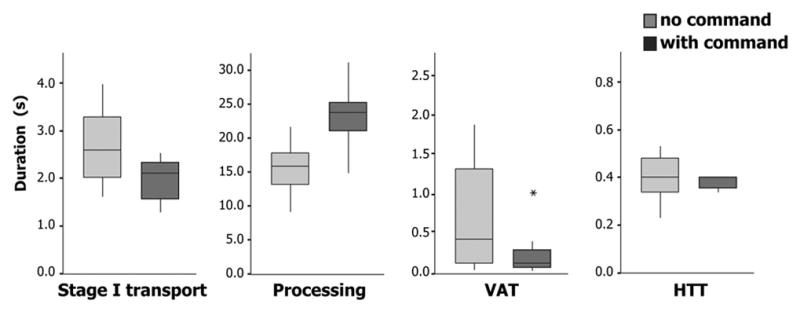
Figure 2.

Timelines showing the duration of each recorded sequence in each subject, including sequences with command (WC) and with no command (NC). Times are as recorded, not averaged). The length of each horizontal bar reflects the total sequence length. The shading of the bar indicates the stage duration for Stage I transport, Processing, Vallecular aggregation time (VAT), and Hypopharyngeal transit time (HTT). WC, with command; NC, no command. The black dot shows the time of the command.
