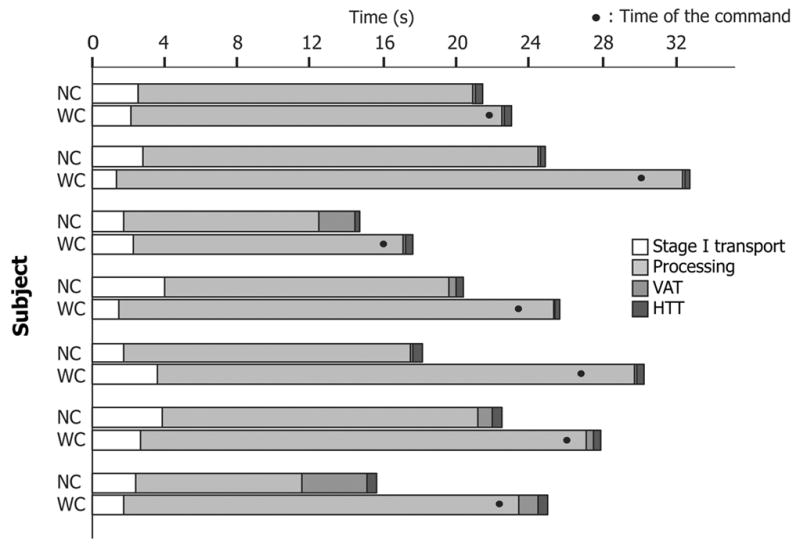
Figure 3.

Duration of each stage in the sequence (box and whisker plot), comparing sequences with command and with no command. Note that the amplitude of the Y axis varies. The box represents median, and 1st and 3rd quartile values. The ends of the whiskers show the largest and smallest observed values that are less than 1.5 box lengths from either end of the box. The asterisk represents an outlier.
