
Figure 1.
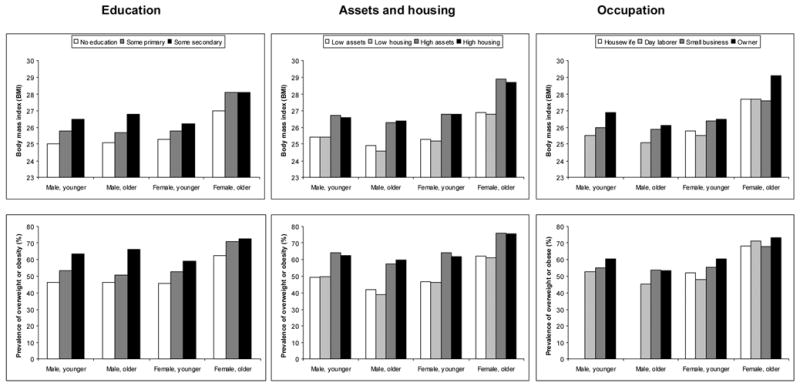
Body mass index (BMI) in top row and prevalence of overweight (25≤BMI<30) and obesity (BMI≥30) in bottom row of males and females by educational attainment (three categories), assetsa and housingb (each split at median), and occupationc (four categories). Groups are divided by age at the median (by sex).
a. Assets variable was developed using principal components analysis summarizing twelve asset variables (e.g. television, radio, blender). Data were collected in 1997.
b. Housing variable was developed using principal components analysis summarizing six housing variables (e.g. roof, walls, floor). Data were collected in 1997
c. Occupation categories are: “Housewife”; “Day laborer”, which includes people working as maids and domestic servants; “Small business”, which includes those employed in a family or other small business; and “Owner”, which includes those working as a patrón or owner of a small business