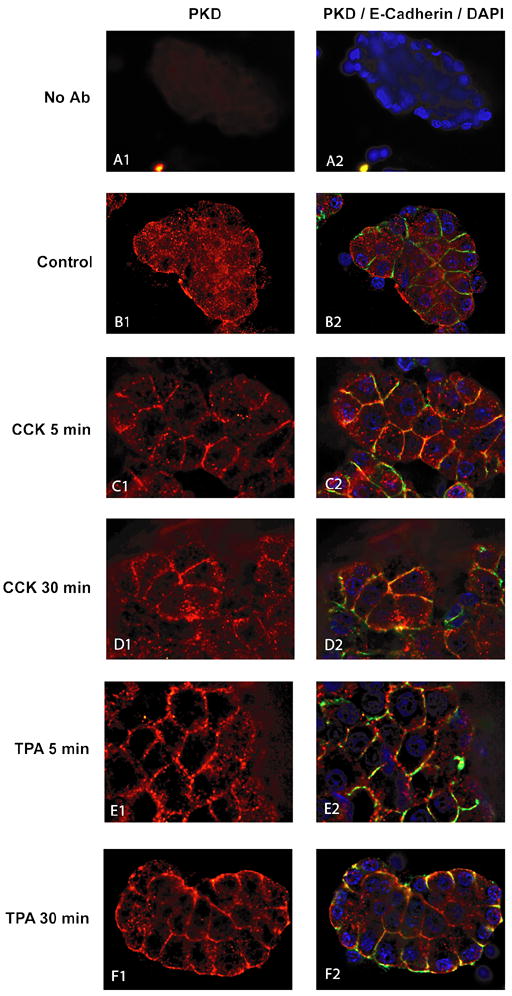
Fig. 11. PKD immunofluorescense-cytochemistry in rat pancreatic acini with and without CCK treatment.

Pancreatic acini were incubated with no addition, CCK (10 nM) or TPA (1 μM) for time periods indicated below. After stimulation cells were washed, fixed, permeabilized and transferred onto poly-L-lysine coated glass slides by cytocentrifugation as described in Methods. Cells were then labeled using polyclonal rabbit anti-PKD (Santa Cruz, C-20) and mouse anti E-cadherin primary antibodies. Specific binding was detected using an Alexa Fluor555- and Fluor488-conjugated secondary antibodies so that red staining represents staining for total PKD and green staining represents E-caadherin. Nuclei were counterstained using DAPI (blue). Fluorescent images were collected using a Leica CTR5000 microscope. Panels A1–2 show acini without the addition of the primary antibodies but with normal isotype-matched serum as a negative control. Panels B1–2 shows acini treated with incubation buffer only. Panels C1-2 and E1-2 show cells treated for 5 min with 10 nM CCK (panels C1-2) or 1 μM TPA (panel E1-2). Panels D1-2 and F1-2 show cells treated for 30 min with 10 nM CCK (panel D1-2) or 1 μM TPA (panels F1-2). Shown are results of a typical experiment representative of 6 independent experiments. Cells shown are representative of >90% of total cells present.
