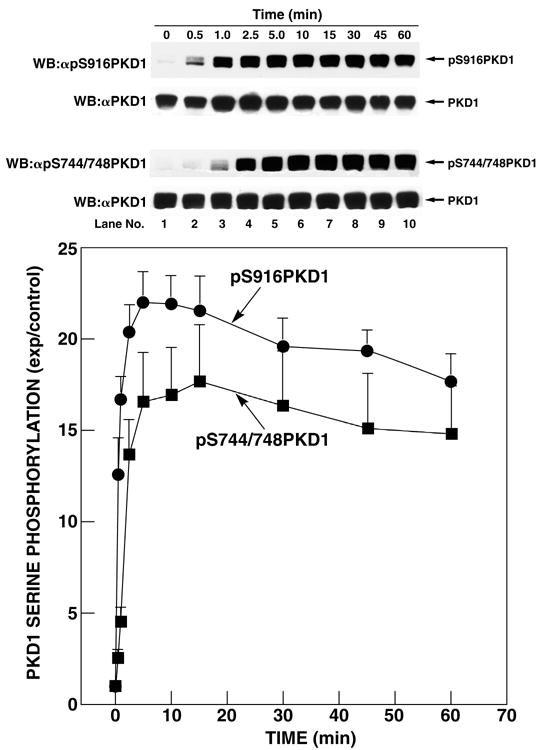
Fig. 4. Time course of CCK stimulation of PKD1 S916 and S744/748 phosphorylation in rat pancreatic acini.

Rat pancreatic acini were treated with no additions or with 10 nM CCK for the indicated periods of time and then lysed. Upper 2 panels: membranes were analyzed using anti-pS916 PKD1 Ab (panel 1). To verify loading of equal amounts of protein, membranes were stripped and re-blotted with anti-PKD1 Ab (panel 2). Lower 2 panels: membranes were analyzed using anti-pS744/748 PKD Ab (panel 3). To verify loading of equal amounts of protein, membranes were stripped and re-blotted with anti-PKD1 Ab (panel 4). The bands were visualized using chemiluminescence and quantification of phosphorylation was assessed using scanning densitometry. The upper part shows a representative experiment. The values shown in the bottom part are the means ± S.E. of 4 independent experiments and are expressed as fold increases over the pretreatment level (exp/control).
