
Figure 1.
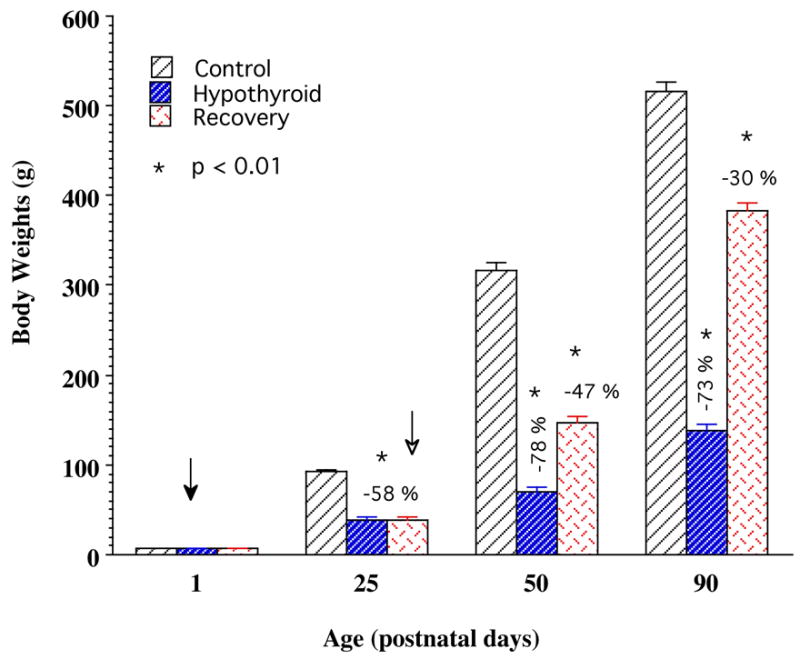
Body weights of the growing rats of the control, hypothyroid, and recovery groups at postnatal days 25, 50, and 90. Note that hypothyroid rats show significantly retarded body growth rates that persist over the entire duration of the study. Recovery rats exhibit accelerated body growth initiated after withdrawal of PTU, resulting in a marked gain in mean body weight. Bars represent mean body weights ± S.E.M. (n >10 animals at each data point). Filled arrow indicates the time of starting PTU treatment and open arrow the time of stopping PTU treatment (beginning rehabilitation).