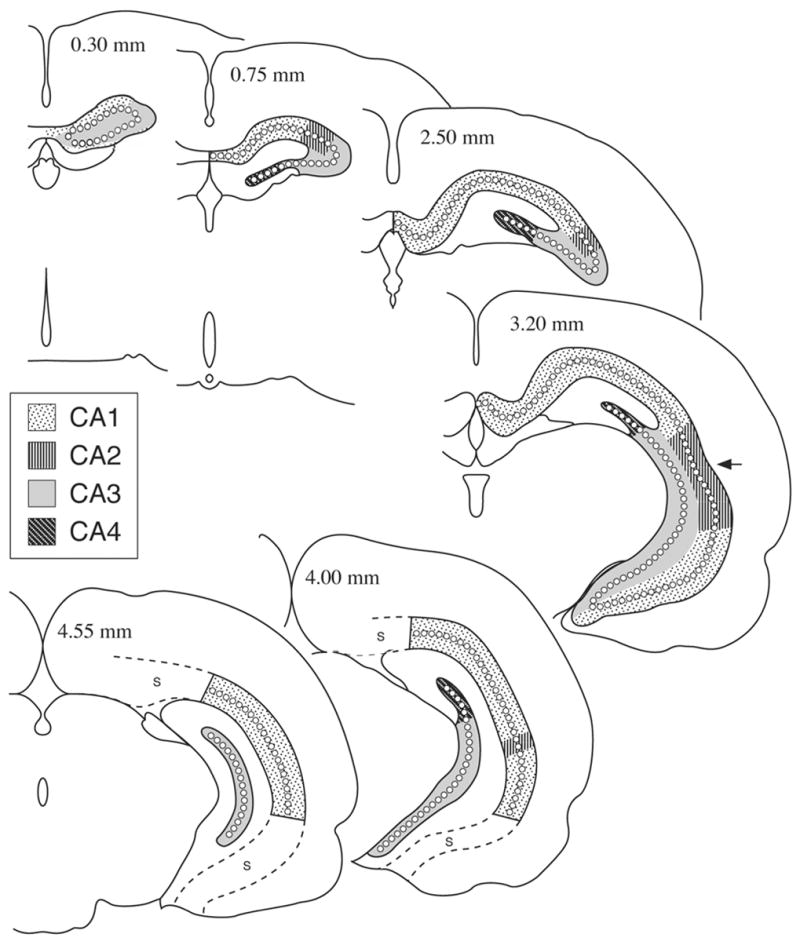
Figure 2.

Representative schematic sections of the adult (P 90) rat brain hippocampus (HC) as appearing in frontally cut rostrocaudal series, indicating the exact borderline of the CA1–CA4 regions. Sections like these were used to develop the regional morphometric maps of the present report. Note that dorsal HC appears in the entire extent of HC, while the ventral HC appears mainly in the posterior half. Numbers in the upper portion of the sections indicate the distance in mm from the anterior pole of the HC; S, subiculum; arrow indicates the approximate dorso-ventral midline.
