
Figure 6.
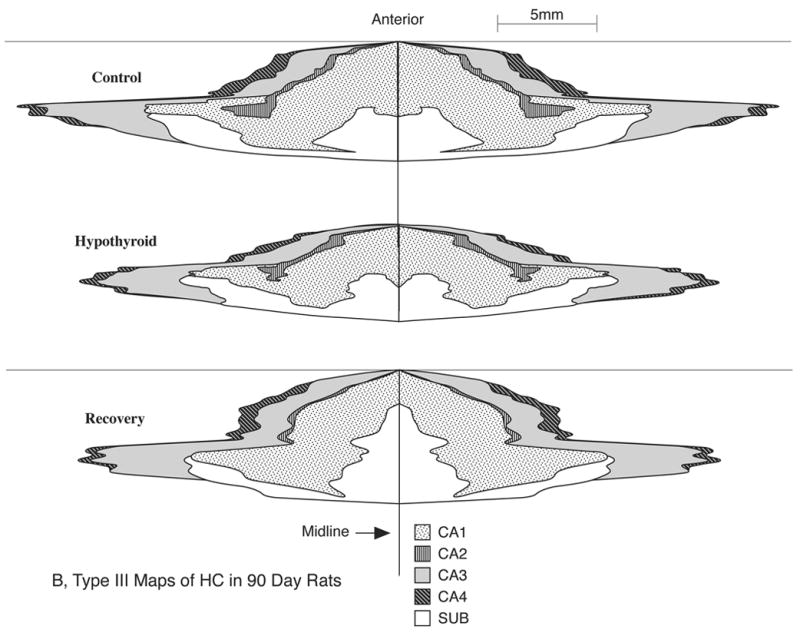
Comparison of Type III 2D fold-out maps of the regional hippocampus (HC) surface area in typical P90 control (top), hypothyroid (middle) and recovery (bottom) group male rats. Note graphic depiction of the growth changes in size of HC cortical sheet and its constituent regions and how prolonged hypothyroidism reduces this growth markedly, particularly for CA1 and CA3 regions; also note how the growth reduction is more affected in the anterior-posterior direction than in the lateral direction; note also the marked ability of the HC, particularly CA1 and CA3 regions to show recovery from the early effects of hypothyroidism. These maps represent the entire extent of the HC in both the left and right hemispheres.