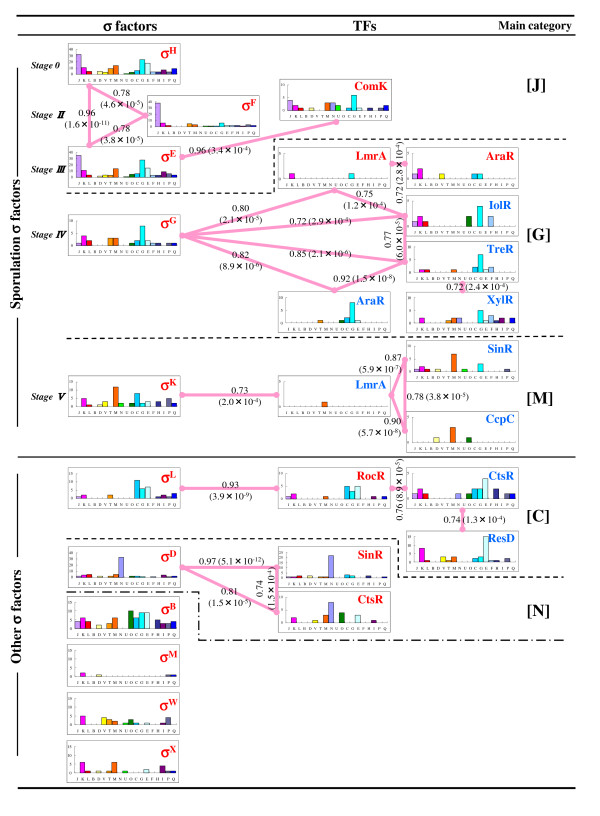
Figure 4.

Clustering of TFs based on the functional similarity of genes composing the TUs. For clustering of TFs, Pearson correlation coefficients among TFs were calculated using the frequencies of genes belonging to each of the COG categories. We regarded groups of TFs that have correlation coefficients above 0.70 (solid lines) as the clusters. Pearson correlation coefficients and P-values in the parentheses are represented on the solid lines. The main category represents the COG category into which the most genes regulated by each of the TFs in the clusters are classified. One-letter abbreviations use used for the functional categories: J, translation, ribosomal structure and biogenesis; K, transcription; L, DNA replication, recombination and repair; D, cell division and chromosome partitioning; O, posttranslational modification and protein turnover, chaperones; M, cell envelope biogenesis and outer membrane; N, cell motility and secretion; P, inorganic ion transport and metabolism; T, signal transduction mechanisms; C, energy production and conversion; G, carbohydrate transport and metabolism; E, amino acid transport and metabolism; F, nucleotide transport and metabolism; H, coenzyme metabolism; I, lipid metabolism; Q, secondary metabolite biosynthesis, transport and catabolism. All data were identified under PWM with 1% threshold and FDR control.
