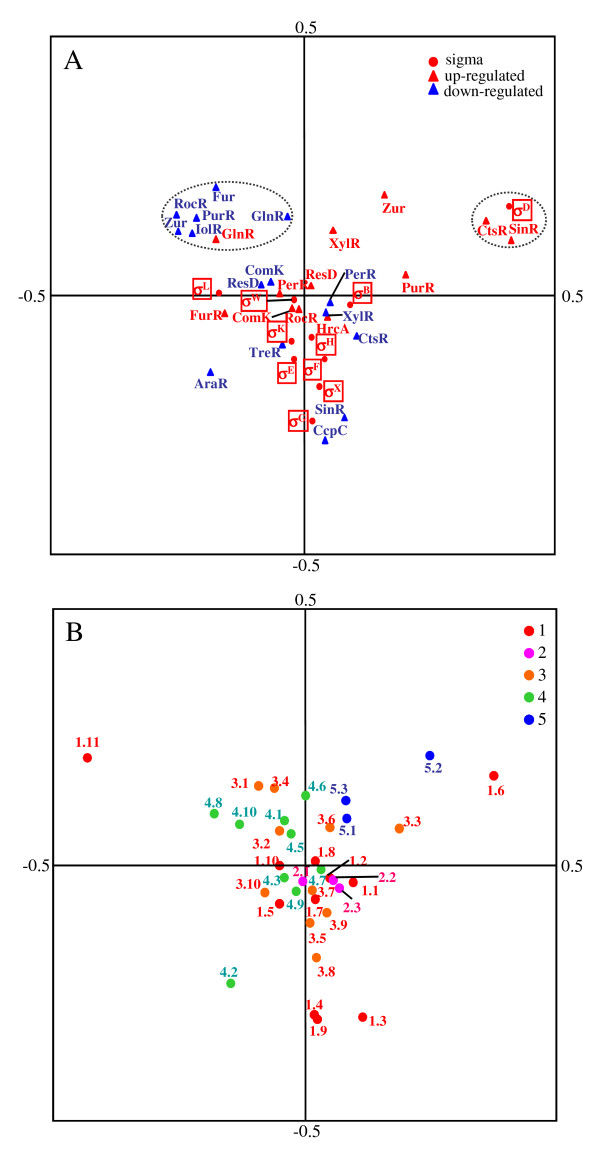
Figure 5.

Score plots for PCA of TFs and functional categories. (A) Score plot based on frequencies of TF functions. (B) Score plot based on frequencies of functional classification of the B. subtilis protein-encoding genes. Abbreviations for the functional categories: 1, cell envelope and cellular processes [1.1, adaptation to atypical conditions; 1.2, cell division; 1.3, cell wall; 1.4, germination; 1.5, membrane bioenergetics (electron transport chain and ATP synthase); 1.6, motility and chemotaxis; 1.7, protein secretion; 1.8, sensors (signal transduction); 1.9, sporulation; 1.10, transformation/competence; 1.11, transport/binding proteins and lipoproteins]; 2, cytochromes [2.1, cytoplasmic; 2.2, membrane-bound; 2.3, other cytochromes]; 3, information pathway [3.1, competence regulatory; 3.2, detoxification; 3.3, DNA packaging and segregation; 3.4, DNA replication; 3.5, DNA restriction/modification, repair and recombination; 3.6, protein folding; 3.7, protein modification; 3.8, protein synthesis; 3.9, RNA modification; 3.10, RNA synthesis]; 4, intermediary metabolism [4.1, antibiotic production; 4.2, carbohydrates and related molecules; 4.3, degradation; 4.4, general function prediction; 4.5, metabolism of amino acids and related molecules; 4.6, metabolism of coenzymes and prosthetic groups; 4.7, metabolism of lipids; 4.8, metabolism of nucleotides and nucleic acids ; 4.9, metabolism of phosphate; 4.10, metabolism of sulfur]; 5, other functions [5.1, antibiotic production; 5.2, phage-related functions; 5.3, transposon and insertion elements].
