
Figure 4.
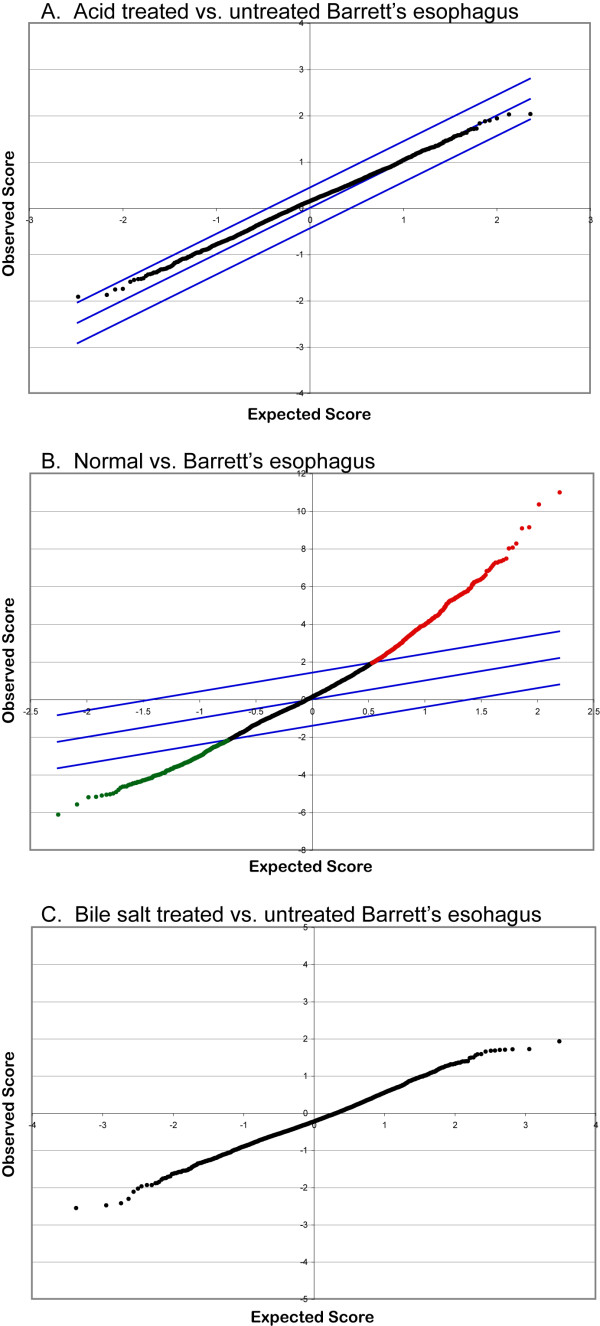
SAM plots of expected to observed values. A: acid treated (3 arrays) versus untreated (5 arrays) primary cultures of Barrett's esophagus (delta = 0.440116) (top). B:Normal (8 arrays) versus Barrett's esophagus (5 arrays) primary cultures (delta = 1.410536). Red signifies 545 genes that are overexpressed at least 3 fold and the green represents 258 genes that are underexpressed. C. Barrett's esophagus samples from 3 patients treated with conjugated bile salts versus no treatment.