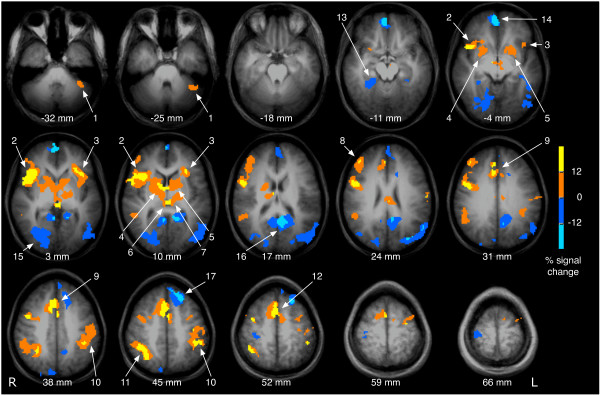
Figure 1.

Brain activation associated with processing of the probe. The figure shows brain activation and deactivation associated with the processing of the probe (either 25 Hz or higher) across all conditions (clustered activation images with an overall corrected p < 0.05). Activated areas are colour-coded in yellow and red, deactivated areas are displayed in blue. Activation is seen in the left cerebellar hemisphere (1), the bilateral anterior insula (2, 3), the bilateral head of the caudate nucleus and the globus pallidus (4, 5), the bilateral thalamus (6, 7), the right inferior frontal cortex (8), the anterior cingulate cortex (9), the left (contralateral) sensorimotor cortex (10), the right posterior parietal cortex (11) and the supplementary motor area (12). Deactivation was found in the right parahippocampal gyrus (13), the bilateral medial frontal gyrus (14), the right cuneus (15), the bilateral posterior cingulate gyrus (16), the bilateral precuneus (16) and the left superior frontal gyrus (17). Brain images are shown in radiological convention (the right hemisphere is seen on the left side of the image).
