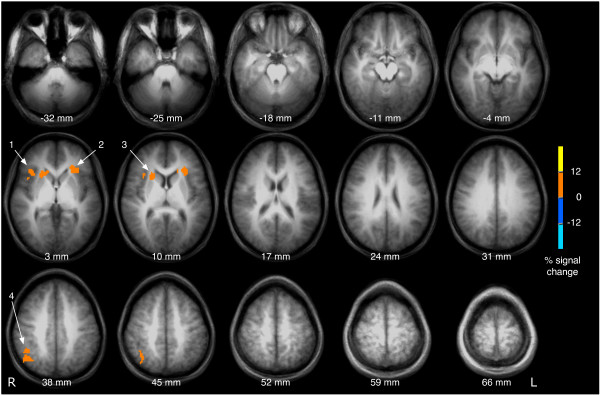
Figure 2.

The effect of a delayed probe. For this figure, brain activation associated with the processing of the probe was compared between conditions with long and short interstimulus interval (8 s vs. 2 s interval between cue and probe). Clustered activation images with an overall corrected p < 0.05 are shown. The right (1) and left insula (2) as well as the right head of the caudate nucleus and (3) and the right inferior parietal cortex (4) were significantly stronger activated following the probe in trials with an ISI of 8 s compared to trials with an ISI of 2 s. Brain images are shown in radiological convention (the right hemisphere is seen on the left side of the image).
