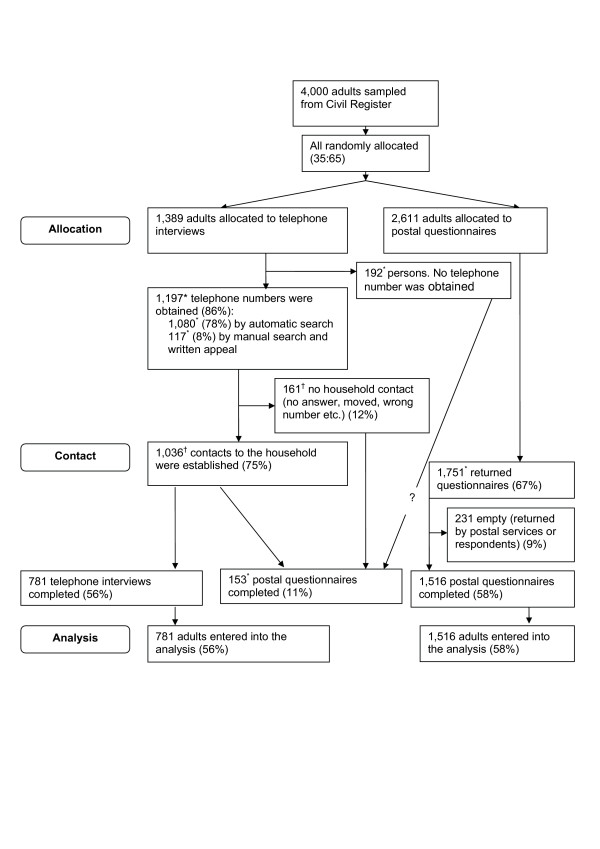
Figure 1.
Flow diagram. The flowchart was not made immediately following data collection. Various slightly inconsistent summaries of the events between the random allocation and data processing exist. We have done our best to reconstruct the flowchart but had to indicate some unexplainable deviations between different archived summaries. Other versions of the flowchart may be requested from the authors.
* Number deviates with 1–10 in different summaries of the data collection log.
† Number deviates with more than 10 in different summaries of the data collection log.

