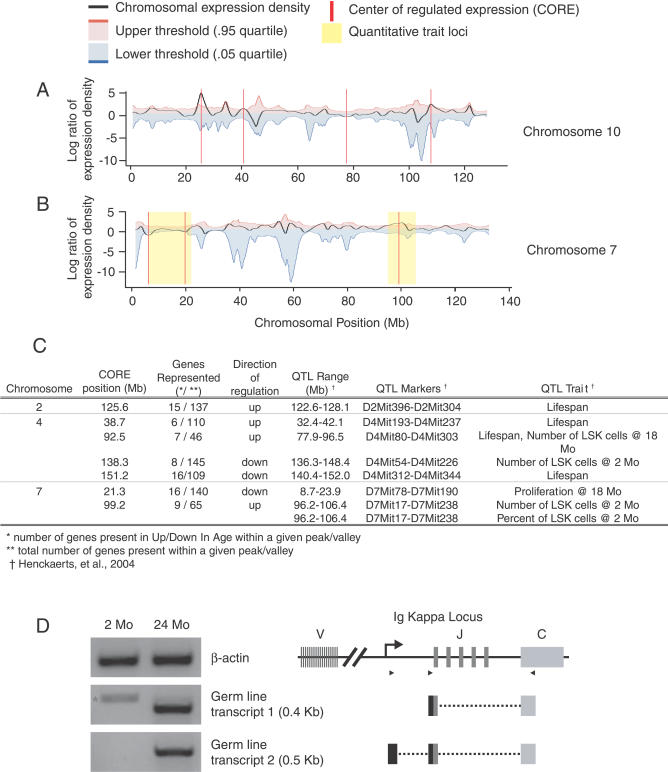
Figure 5. Density Plots of Coordinately Regulated Gene Expression for Chromosomes 4, 7, 10, and 13.
(A) The black line represents the local density of coordinate regulation for all unique microarray probes. A positive value (peak) indicates a region where there are a greater number of up-regulated genes, whereas a negative value (valley) corresponds to a region of several down-regulated genes. The red vertical line indicates a CORE that extends beyond the threshold of significance (blue and red lines; p < 0.05) estimated by 1,000 randomized test sets.
(B) Alignment of COREs on Chromosome 7 with previously published QTLs that represent chromosomal regions involved in age-related HSC function and organismal lifespan. Only those COREs that localize within established QTLs are shown.
(C) Table showing the chromosomal alignment of COREs with known QTLs. QTLs are found on Chromosomes 2, 4, and 7 that contain COREs.
(D) RT-PCR for IgK GL transcripts and diagram of transcript alignment with the GL IgK locus. The star (*) in the first lane, for GL transcript1, indicates a cDNA amplicon in young HSC that does not align with the IgK locus.

