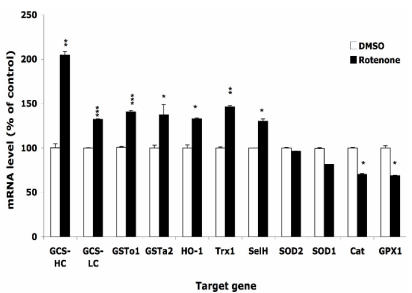
Figure 3.
Effects of rotenone treatment on gene expression in HT22 cells. The gene expression level of superoxide dismutase 1 and 2 (SOD1, SOD2), glutathione peroxide 1 (GPx1), catalase (Cat), glutamylcysteine synthetase heavy chain and light chain (GCS-HC, GCS-LC), glutathione s-transferase omega 1 and alpha 2 (GSTo1, GSTa2), heme oxygenase 1 (HO-1), thioredoxin reductase 1 (TR1), and selenoprotein H (SelH) in HT22 cells after treatment with 0.5 µM rotenone for 16 h. Average values and SD are shown.

