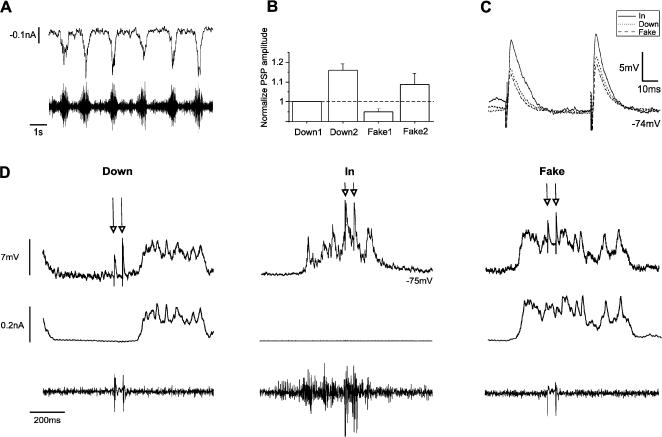
Figure 7. Paired pulse facilitation during up versus down states of fake oscillations.
A. Intracellular recording in voltage clamp during a recording of slow oscillations from a neuron in a slice of the ferret visual cortex (top trace) and multiunit activity in the vicinity of the recorded neuron, illustrating the occurrence of rhytmic activity in the network (bottom trace). B. Relative amplitudes of the first and second PSPs induced during down states versus fake up states. Amplitudes are normalized with respect to the amplitude of the first PSP in the down state. Averages correspond to n = 7 neurons. C. Averaged amplitudes of the first and second PSPs in the pair occurring from a neuron (in D) while comparing three situations: down states, synaptically generated up states and fake up states. Note that the ones occurring during the actual up states are of larger amplitude. D. Raw traces showing examples from the same neuron as in C with pairs of PSPs ocurring during down states (left), up state (center) and fake up state (right). The middle trace is Im (nA) and the bottom trace is the multiunit recording illustrating network activity in the vicinity of the neuron. Note that only in the middle panel, which is a spontaneously generated up state, there is network activity during the up state. The stimuli artifact from the electrical stimulation to activate the PSPs can be seen in the three cases.

