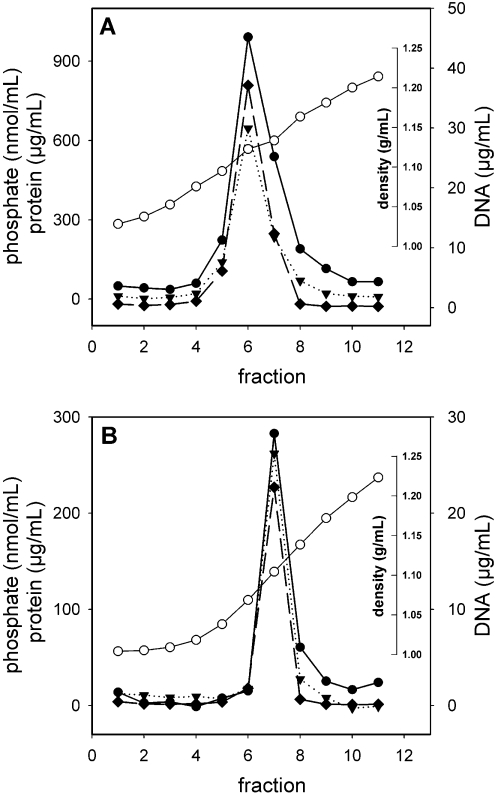
Figure 1. Equilibrium density-gradient analysis of DNA virosomes.
DODAC virosomes (A) and DOTAP virosomes (B) with encapsulated pDNA were centrifuged to equilibrium on a 10–60% linear sucrose density-gradient. Fractions were analysed for protein (filled circles), phosphate (filled triangles) and DNA (filled diamonds). The density of the fractions (open circles) was determined by measuring the refractive index.

