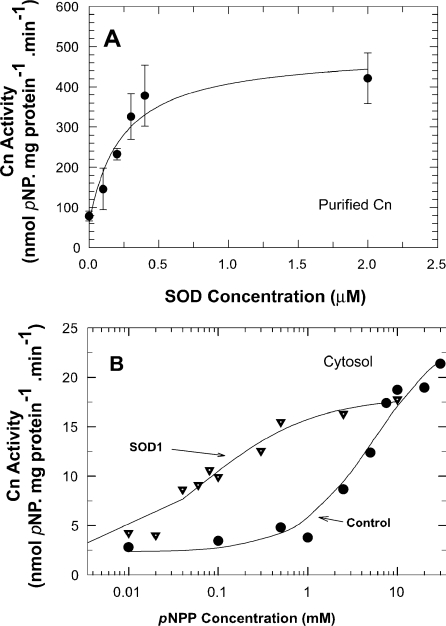
Figure 2. Kinetics of activation of Cn by SOD1.
(A) Concentration-dependent effects of SOD1 on purified Cn. Cn (0.2 μM) was pre-incubated with various concentrations of SOD1 and activity was measured. Results are means±S.E.M. for three determinations from two experiments. Data were fitted to the equation V=V0+Vmax·[SOD1]/(Kact+[SOD1]). Basal Cn activity: 78.3 nmol/min per mg of protein. (B) SOD1 effects on substrate activation of Cn. Cn in rat brain cytosol was pre-incubated with or without 2.7 μM SOD1 for 25 min at 30 °C, and Cn activity was measured using increasing concentrations of pNPP. Results are from two determinations from two experiments. Curves are non-linear least-squares fitting of data to the equation V=Vmax·[pNPP]h/(Km+[pNPP]h).

