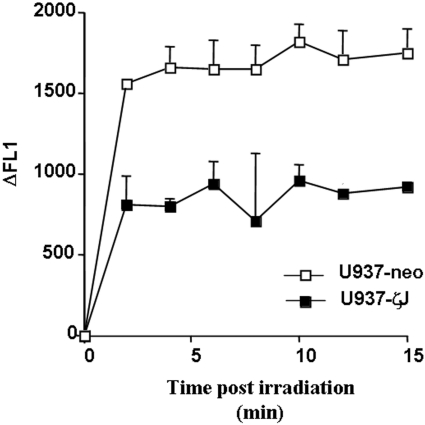
Figure 4. Effect of PKCζ overexpression on UV-C-induced ROS production.
U937-neo (□) and U937-ζJ (■) cells were labelled with C2938, a fluorescent probe, and irradiated with 30 J/m2 of UV-C light, and ROS production was then analysed at different time points by flow cytometry. Results correspond to the difference of fluorescence (ΔFL1) between treated and untreated cells and are means+S.D. of triplicate determinations of a representative experiment.

