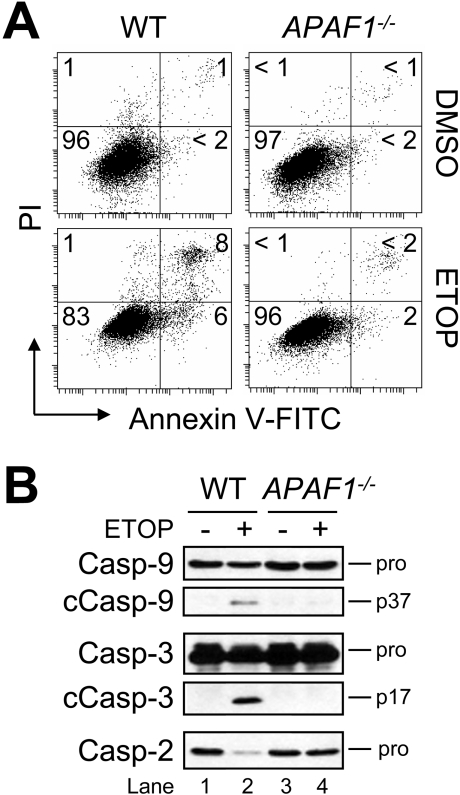
Figure 4. Suppression of drug-induced procaspase activation and apoptosis in APAF1−/− MEFs.
(A) Wild-type (WT) and APAF1−/− MEFs were cultured with DMSO or 50 μM ETOP for 24 h and processed for cell death determination by flow cytometric analysis of annexin V–FITC and PI staining. Quadrants are defined as: live (lower left), early apoptotic (lower right), late apoptotic (upper right) and necrotic (upper left). Numbers refer to the percentage of cells in each quadrant. (B) Duplicate aliquots of cells were harvested and lysed for Western blotting. cCasp, cleaved caspase.

