
Figure 1.
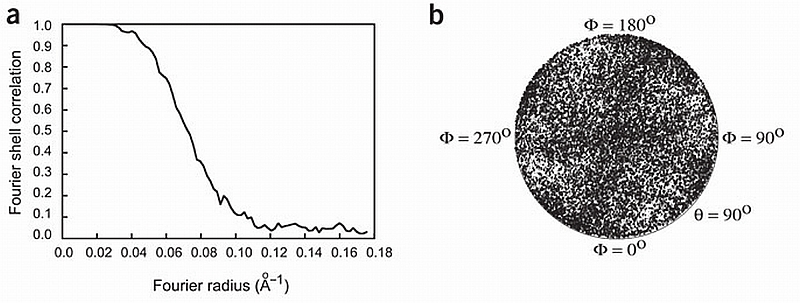
Image processing. (a) Fourier shell correlation curve indicating a resolution of 10.3 Å according to the 0.15 cutoff criterion. (b) Plot of the angular distribution of the particles used in the three‐dimensional reconstruction showing a uniform distribution of orientations of the vitrified RyR.