
Figure 3.
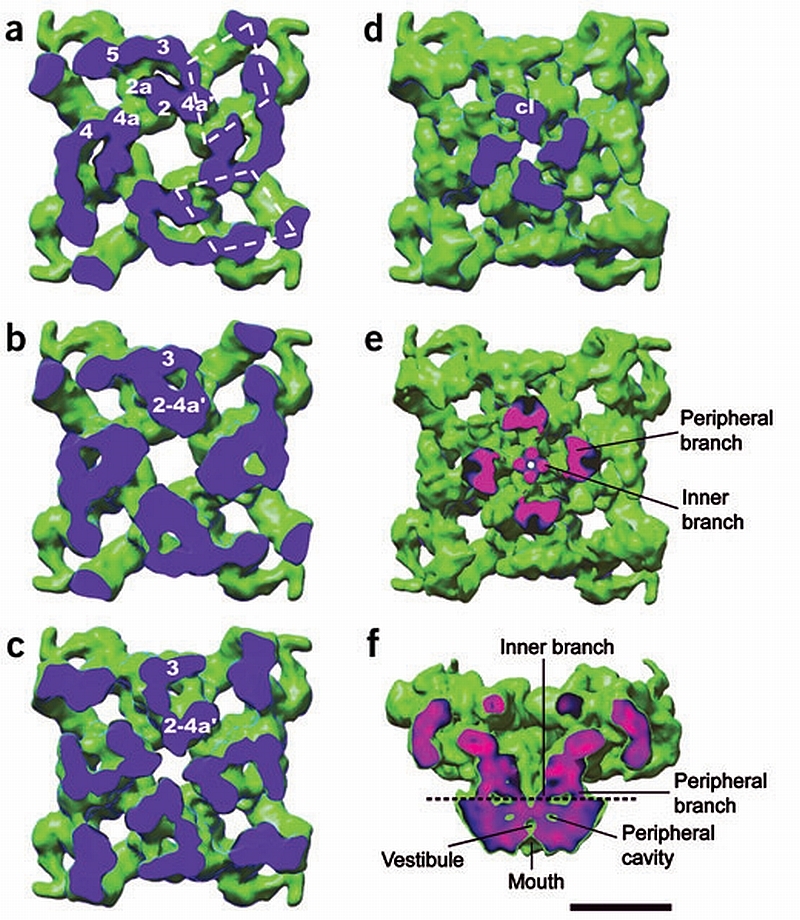
Internal structure of the cytoplasmic assembly and the columns. (a–d) Successive sections of the cytoplasmic assembly seen from the SR face show internal mass arrangements and interdomain connections. The sectioning plane is blue. The cytoplasmic domains are interconnected as follows. Below the T‐tubule‐facing surface domains 2 and 4a′ (from adjacent rhomboids) fuse (a). At a lower level, domains 2a and 3 interconnect through a second bridge of density and merge with domains 2‐4a′ (b,c). Therefore each structure formed by the fusion of domains 2‐2a‐3‐4a′ becomes a column of density (d). The four columns of density (cl) in (d) merge into the transmembrane assembly. (e) Section of RyR1 cut along the plane indicated by the dashed line in f seen from the SR lumen, displayed at a slightly higher threshold to show the internal and peripheral regions of the columns. (f) Slice across the side view showing the two branches of each column. The plane of the cut in e,f is color‐coded, with pink corresponding to denser structures and blue to less dense structures. Scale bar, 10 nm.