Figure 3.
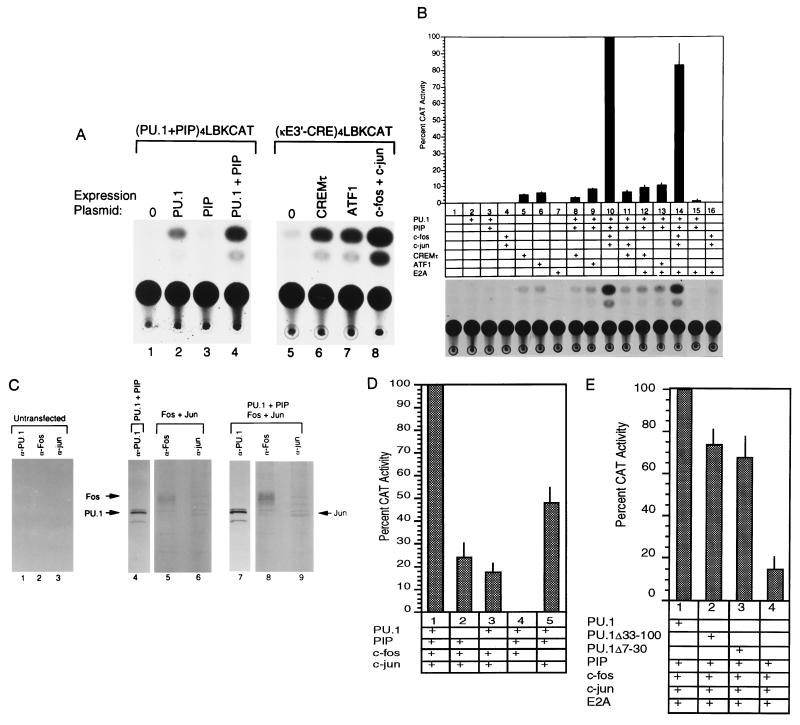
Transcriptional activation by enhancer binding proteins. (A) PU.1, PU.1 plus PIP, CREMτ, ATF1, and c-Fos plus c-Jun can activate reporter plasmids containing multimers of their binding sites. Transfections were performed in NIH 3T3 cells with reporter plasmids (PU.1 plus PIP)4LBKCAT (lanes 1–4) or (κE3′–CRE)4LBKCAT (lanes 5–8). Expression plasmids included in each assay are indicated above the lanes. Fold activation levels are as follows: PU.1, 3.7 ± 1.6; PIP, 0; PU.1 plus PIP, 18.4 ± 8.1; CREMτ, 6.6 ± 3.4; ATF1, 8.1 ± 2.6; c-Fos plus c-Jun, 40.5 ± 20. (B) Maximal transcriptional synergy requires PU.1, PIP, c-Fos, and c-Jun. The CoreLBKCAT reporter plasmid was transfected into NIH 3T3 cells either alone (lane 1), or in the presence of various expression plasmids (lanes 2–16). (Bottom) CAT assays. (Top) Histogram of the data averaged from 3 to 5 independent experiments. Thin lines represent standard deviations. (Middle) Expression plasmids included in each transfection. (C) Expression of transfected proteins. NIH 3T3 cells were either untreated (lanes 1–3), or transfected with PU.1 and PIP (lane 4), c-Fos and c-Jun (lanes 5 and 6), or PU.1, PIP, c-Fos, and c-Jun (lanes 7–9). After transfection, cells were metabolically labeled with [35S]methionine and [35S]cysteine and then lysed. Lysates were immunoprecipitated with α-PU.1, α-c-Fos, or α-c-Jun antibodies then subjected to SDS/PAGE. The identity of the antibody used is shown above each lane, and the positions of PU.1, c-Fos, and c-Jun proteins are shown by arrows. (D) Omission of PU.1, PIP, c-Fos, or c-Jun expression plasmid reduces enhancer activity. (Lower) NIH 3T3 cells transfected with the various expression plasmids. (Upper) Histograms of enhancer activity for each transfection. Activity with PU.1, PIP, c-Fos, and c-Jun was defined as 100%. Thin lines represent standard deviations. (E) The PU.1 transactivation domain is not necessary for stimulation of enhancer activity. NIH 3T3 cells were transfected with PIP, E2A, c-Fos, and c-Jun in the presence of either wild-type PU.1 or PU.1 transactivation domain mutants (Δ33-100 and Δ7-30). The histogram shows relative enhancer activities with the activity observed with PU.1, PIP, c-Fos, c-Jun, and E2A defined as 100%. Thin lines represent standard deviations.

