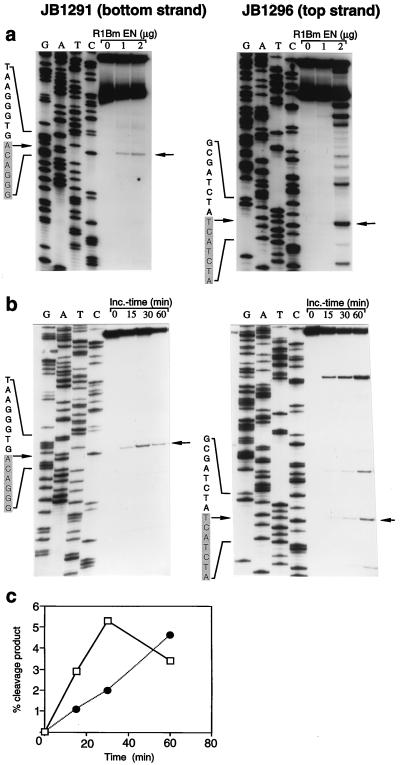
Figure 3.
Sequence-specific cleavage of the R1Bm target DNA. (a) A 175-bp fragment centered around the R1Bm insertion site was synthesized by PCR with individually 5′ end-labeled primers JB1291 (bottom strand) or 1296 (top strand) and pB109 template. The radioactive full-length double-stranded target DNAs were incubated without or with 1 or 2 μg of R1Bm EN protein. Arrows indicate the major sites of cleavage that correspond to the tsd boundaries indicated in Fig. 1a; tsd sequences are shaded. The molecular weight standards were dideoxy sequencing reactions primed with the same radioactive oligonucleotides on pB109 template. The exact positions of the major cleavages were confirmed by mixing experiments in which the products were mixed with the molecular weight standards (not shown). The faster moving band in the substrate in part a was shown to correspond to incompletely denatured double-stranded DNA and could be eliminated from subsequent experiments by denaturing by boiling for 10 min in 95% formamide. (b) The cleavage of the bottom strand at lower enzyme concentrations than the top strand (part a above) suggested that bottom strand cleavage might precede top strand cleavage kinetically. This was confirmed in a time course experiment. The experiment was performed as above except with 2 μg of R1Bm EN, and samples were removed at 0, 15, 30, and 60 min. Note that cleavage at the target sequence boundary (arrow) on the bottom strand (JB1291) peaks at 30 min whereas top strand cleavage (JB1296) peaks later. (c) The radioactivity in the bands representing the target sequence boundary cleavages was measured by PhosphorImager analysis, expressed as percent of initial substrate, and plotted as a function of time. Late in the reaction, the signal begins to decrease, suggesting the presence of a small amount of a contaminating random nuclease activity. Solid line, bottom strand; dotted line, top strand.

