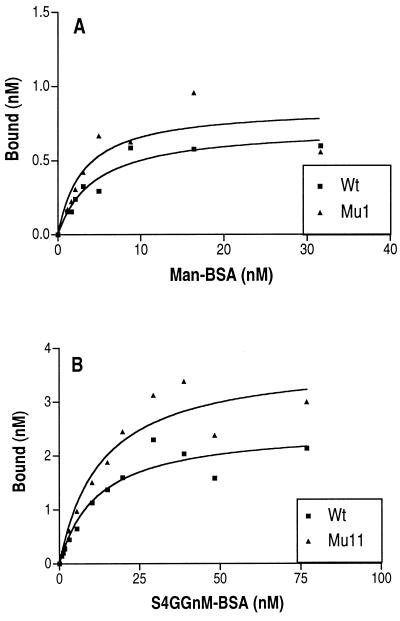
Figure 3.
Comparisons of saturation curves for Man-BSA and S4GGnM-BSA binding curves were obtained for Man-BSA with Man/S4GGnM-Fc(Wt) and (Mu1) (A) and for S4GGnM-BSA with Man/S4GGnM-Fc(Wt) and (Mu11) (B) using the assay described in Fig. 2. The apparent Kd was determined by using nonlinear regression analysis providing the results summarized in Table 1. Three-fold more Man/S4GGnM-Fc(Wt) was used to analyze S4GGnM-BSA binding in B than for analysis of Man-BSA binding in A. At saturation, Man/S4GGnM-Fc(Wt) bound the same amount of Man-BSA and S4GGnM-BSA per μg of chimera.

