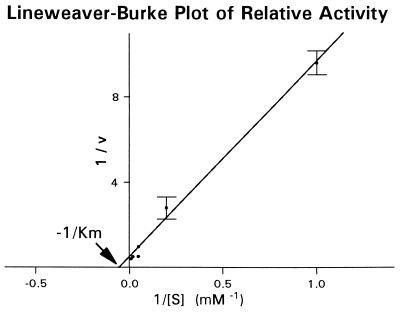
Figure 2.
Lineweaver–Burke plot of the sucrose concentration dependence of relative sucrase activity of everted sleeves of mouse intestine. From intestines of each of three mice, 15 consecutive sleeves centered around the mid-intestine were cut and incubated in Ringer’s solution containing 5, 20, or 50 mM sucrose (isosmotically replacing NaCl). To correct for variation in sucrase activity with intestinal position, all sleeves incubated in 5 or 50 mM sucrose were bracketed by adjacent sleeves incubated in 20 mM sucrose, in the sequence (from proximally to distally) 20, 5, 50, 20, 5, 50, 20, 5 … 20 mM. From each of three other mice, 15 sleeves were similarly incubated in Ringer’s solution containing 1, 20, or 100 mM sucrose, in the sequence (from proximally to distally) 20, 100, 1, 20, 100, 1, 20, 100 … 20 mM. For each mouse, we then calculated the average value of the ratio of activity at 5, 50, 1, or 100 mM to activity in the bracketing pair of sleeves at 20 mM. The figure is a Lineweaver-Burke plot of the fit of the resulting data to the Michaelis–Menten equation: i.e., the ordinate is (1/V), the reciprocal of activity (relative to activity at 20 mM in the same mouse), and the abscissa is (1/[S]), reciprocal sucrose concentration (mM−1). Values are means for three mice, and error bars are standard errors. Note the good fit (R2 = 1.00) to the straight line (1/V) = 9.1 (1/[S]) + 0.5. The negative inverse of the x-intercept is Km, the effective Michaelis constant of sucrase in everted sleeves of mouse intestine: 18 mM.

