
Fig. 2.
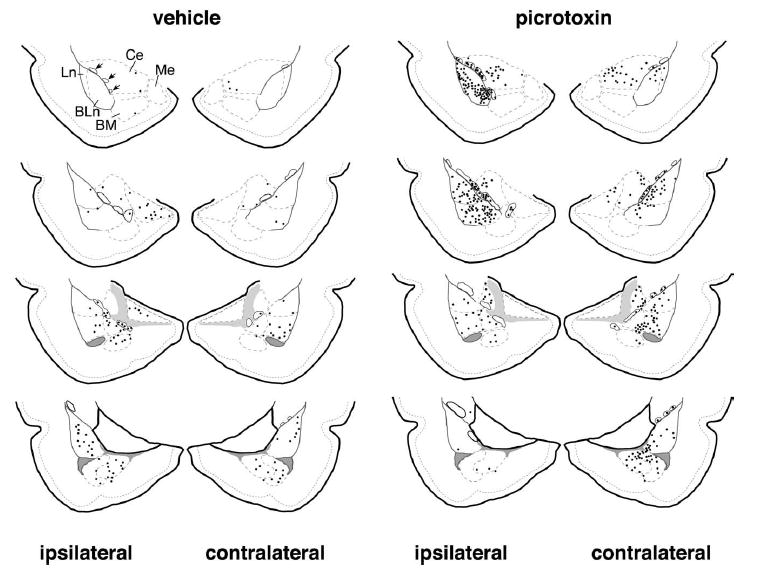
Distribution of Fos-IR cells in rats that received vehicle vs. picrotoxin injections in the infralimbic cortex. Picrotoxin infusion in the infralimbic cortex was associated with an increase of Fos induction overall in the amygdala. Such increase was particularly noticeable within the ITC cell masses, both ipsi- and contra-laterally respect to the injection site. Diagrammatic representations of the amygdala (modified from Swanson, 1992) are shown for representative vehicle- (left) and picrotoxin- (right) treated animals. Sections are displayed in rostro-caudal order from top to bottom. Each black dot represents three Fos-IR nuclei. ITC cell masses are outlined with a continuous line and are marked by arrows in the upper left diagram, while the borders of the other amygdala nuclei are marked with a dashed line. BLn, basolateral nucleus; BM, basomedial nucleus; Ce, central nucleus; Ln, lateral nucleus; Me, medial nucleus.