
Fig. 3.
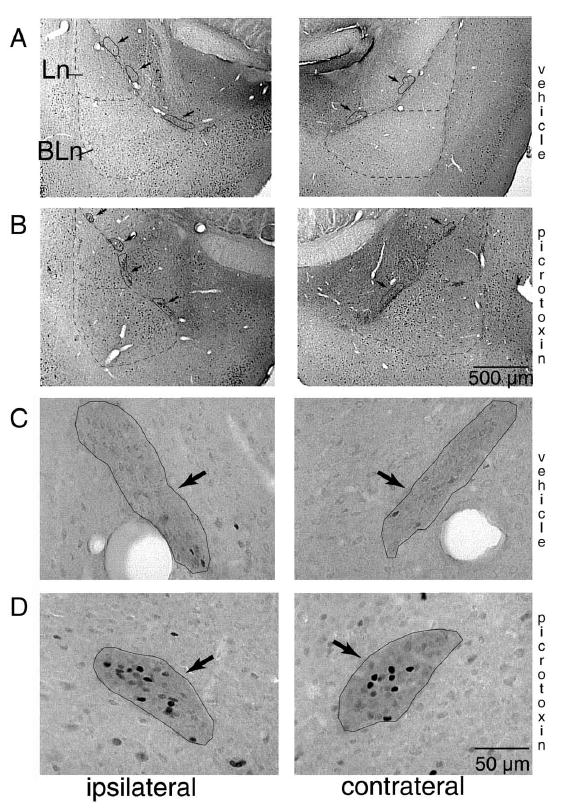
GABA and Fos immunoreactivity in the ITC cell masses. Low (A, B) and high (C, D) magnification microphotographs of brain sections processed for dual antigen immunocytochemistry for GABA and Fos. The borders of the Ln and BLn are indicated with a dashed line while the ITC cell masses are outlined with a continuous line and marked with arrows. Fos-IR nuclei can be seen as darkly stained cell nuclei. GABA immunostaining was detectable as a diffuse neuropil labeling that was sufficiently intense to allow a reliable delineation of the ITC cell masses even though individual cell bodies were only sporadically detected. Sections shown in A (vehicle) and B (picrotoxin) are typical for distribution of Fos-IR nuclei within the amygdalar subnuclei. Statistically significant increases were only detected in the ITC cells masses and in the contralateral lateral nucleus of picrotoxin-treated rats. In C (vehicle) and D (picrotoxin), examples of ITC cell masses are outlined in black. Note the numerous Fos-IR nuclei in the rat treated with picrotoxin (D). BLn, basolateral nucleus; BM, basomedial nucleus; Ce, central nucleus; Ln, lateral nucleus; Me, medial nucleus.