Figure 3.
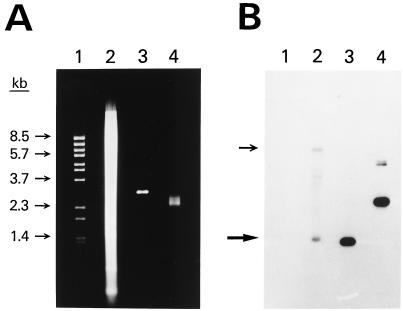
Sequence-specific cloning of a portion of the human int-2 gene. (A) Agarose gel stained with ethidium bromide. Lane 1 shows λ BstEII size standards. Lane 2 shows 20 μg of human genomic DNA that had been digested with EcoRI and BamHI. Lanes 3 and 4 show 0.25 μg of pooled plasmid DNA prepared by using the RAC procedure. The DNA in lane 3 has been digested with EcoRI and BamHI. (B) Southern blot of the gel in A. A 0.6-kb portion of the int-2 gene was used as the probe. Arrows show the positions of both of the alleles of the int-2 fragment. The amount of radioactivity in each band was quantitated by using a BAS 2000 Fujix Bio-Imaging Analyzer. Specifically, using the software of the instrument, each band was centered in a rectangle and the total amount of signal within the rectangle was determined. A rectangle was also placed just above each band to measure the background signal. All rectangles were the same size and shape. In lane 2, the lower allele band gave a reading of 1,420 with a background of 721. In lane 4, the two bands from the plasmid had a combined reading of 15,711 with a background of 1,076. After subtracting the background signal, the ratio of the plasmid signal in lane 4 to the lower allele signal in lane 2 was 20. Because 80 times more DNA was loaded in lane 2 than in lane 4, the total enrichment was 1,600.

