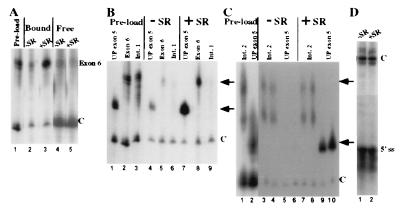
Figure 2.
SR proteins, in a defined system, promote an association of exons that are spliced together in vivo that is specific with respect to intronic RNAs. (A) Association of exon 6 with R17-UP columns in the presence and absence of SR proteins. The relative amount of exon 6 and control RNA added to R17-UP columns is shown (lane 1). The signals from exon 6 and the control RNA are shown for complexes assembled in the absence (lane 2) or presence (lane 3) of SR proteins at a concentration similar to that in standard in vitro splicing reactions. Shown are the signals for supernatant fractions from the complexes shown in lanes 2 and 3 (lanes 4 and 5, respectively). (B and C) Association of intron fragments Int1 and Int2 with R17-UP columns in the presence and absence of SR proteins. (B) The relative amount of UP exon 5, exon 6, and Int1 RNA added to R17-UP affinity columns is shown (lanes 1, 2, and 3, respectively). The signals from the UP exon 5, exon 6, and Int1 RNAs are shown from complexes assembled in either the absence (B, lanes 4–6, respectively), or presence (lanes 7–9, respectively) of SR proteins. (C) The relative amount of UP exon 5 and Int2 RNA added to R17-UP affinity columns are shown (lanes 1 and 2, respectively). The signals from the UP exon 5 and Int2 RNAs are shown from complexes assembled in duplicate in the absence (lanes 3 + 4 and 5 + 6, respectively) and presence (lanes 7 + 8 and 9 + 10, respectively) of SR proteins. (D) The signal from the 5′ splice site RNA is shown from R17-UP affinity complexes assembled in the absence (lane 1) and presence (lane 2) of SR proteins. Because of the small size of the 5′ splice site, a larger control RNA was used in this experiment. In all experiments, one-third of each complex was loaded on each lane. The relative migration of the exon RNAs and the internal control RNAs is indicated to the right of each figure by arrows and Cs, respectively.

