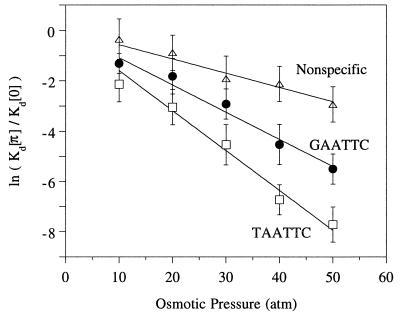
Figure 2.
Dependence of dissociation constant (Kd) on osmotic pressure for EcoRI binding to canonical GAATTC (circles), alternate TAATTC (squares), and nonspecific (triangles) DNA substrates. Symbols indicate the natural log of the ratios of Kd values at 0 and the indicated osmotic pressure (π); the lines represent the best fits by linear regression. Slopes are: GAATTC, −0.108 (±0.003) atm−1; TAATTC, −0.159 (±0.005) atm−1; nonspecific, −0.056 (±0.003) atm−1.

