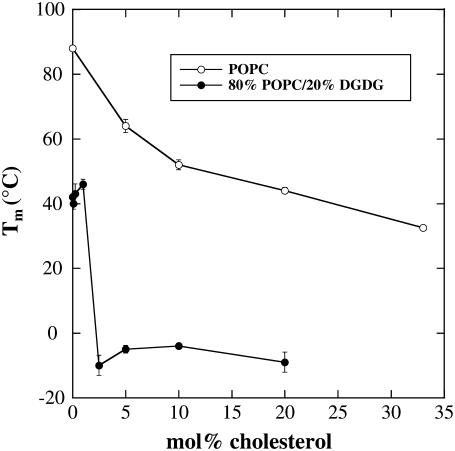
FIGURE 2.
Lipid phase transition temperature (Tm) of dry liposomes prepared from POPC or 80% POPC/20% DGDG as a function of the Chol content of the membranes. Tm was determined as the midpoint of the melting curves shown in Fig. 1. The error bars indicate mean ± SE from measurements on three samples. Where no error bars are visible, they are smaller than the symbols.

