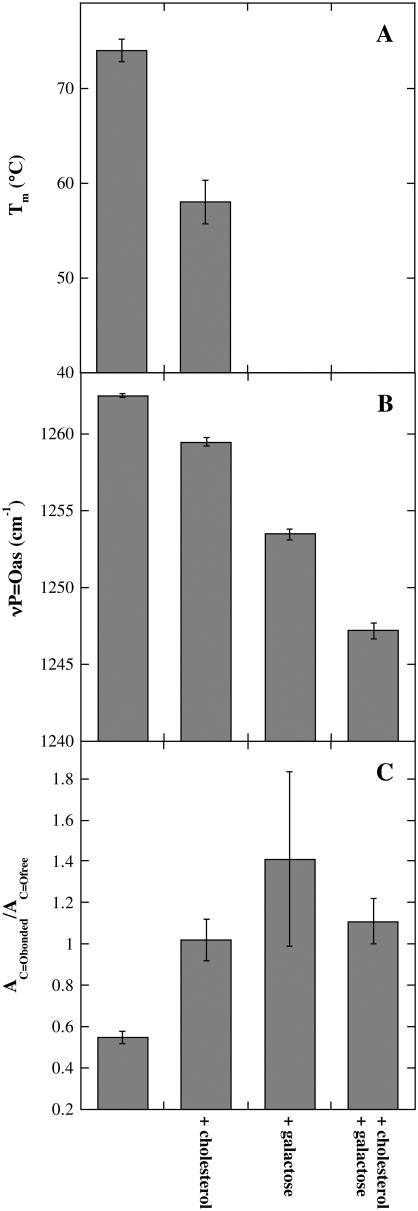
FIGURE 7.
Lipid phase transition temperature (Tm; A), the νP=Oas peak position (B), and AC=Obonded/AC=Ofree ratio (C) determined from dry liposomes composed of 80% POPC/20% DLPC. νP=Oas and νC=O spectra were recorded at 90°C. The samples contained additional Chol and Gal as indicated (compare Fig. 5). The error bars indicate mean ± SE from measurements on three samples.

