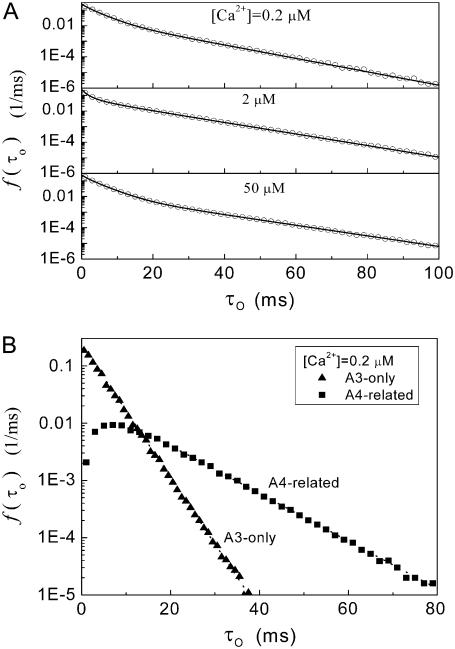
FIGURE 4.
Distributions of open times predicted by the IP3R channel model. (A) Open-time distributions for basal Ca2+ concentrations at [Ca2+] = 0.2, 2, and 50 μM with [IP3] = 10 μM. Open symbols are results of stochastic simulations, and solid curves were obtained from the transition matrix theory. (B) Distributions of channel open durations involving A3-only and A4-related openings, derived from stochastic modeling at [Ca2+] = 0.2 μM and [IP3] = 10 μM.

