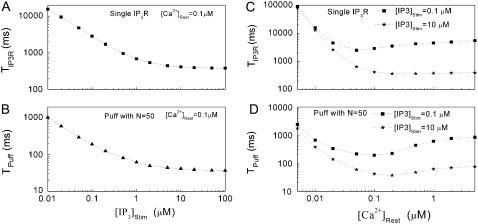
FIGURE 7.
Mean first-opening latencies for single and multiple IP3R after different steps of  at various [Ca2+]. (A and B) The mean first-opening latency of an individual IP3R channel (A) as a function of
  with [Ca2+] = 0.1 μM, and the corresponding latencies for the first opening of any channel among a population of 50 IP3R channels (i.e., the predicted puff latency) (B). (C and D) Corresponding dependence of mean single-channel first-opening latency (C) and puff latency (D) for a cluster of 50 channels as a function of [Ca2+] for
  (stars) and
  (squares).

