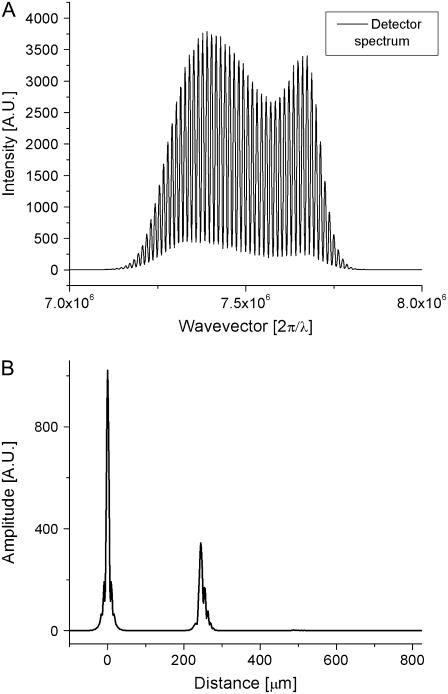
FIGURE 2.
Description of SD-OCT measurement to locate depth-resolved structures. (A) Optical spectrum at the detection arm of the interferometer, showing a strong modulation on the spectrum due to a single reflective surface in the sample arm. (B) Fourier transform of the optical spectrum, giving the spatial information in the sample arm. The peak at zero is a Fourier transform of the source spectrum; the peak at 240 μm is the reflective object causing modulations on the spectrum. The width of the peaks corresponds to axial resolution, which is inversely proportional to the bandwidth of the light source spectrum.

