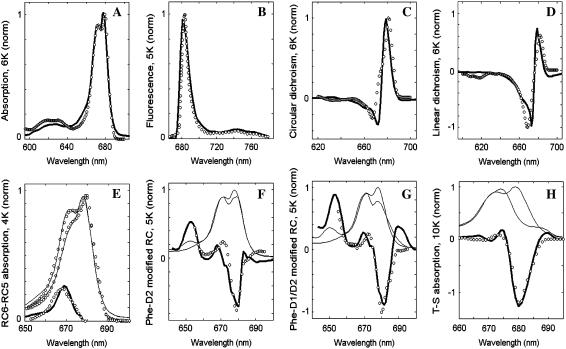
FIGURE 1.
Simultaneous fit of the low-temperature spectra of isolated PSII-RC. Open circles show the experimental data, solid lines (including thick lines in panels A–H and thin lines in E–H) represent calculated spectra. (A, C, and D) Modeling of the 6 K OD, CD, and LD spectra (38,39). (B) Modeling of the nonselective FL profile at 5 K (40). (E) Modeling of the 4 K absorption spectra for normal 6-chlorophyll RC (RC6) and for modified RC lacking one of the peripheral Chlzs (RC5). The calculated RC6, RC5, and difference RC6-RC5 spectra are shown together with the measured ones (41). (F and G) Modeling of absorption changes induced by modification of PheD2 (F) or both PheD2 and PheD1 (G) at 5 K (39). Thin solid lines show absorption spectra calculated for normal and modified RCs (the latter have bleachings near 680 nm and absorption peak near 650 nm due to blue-shift of the modified Phes). (H) Modeling of the triplet minus singlet (T-S) spectra measured at 10 K (39). The calculated T-S spectrum (thick line) is obtained as a difference between the ground-state absorption (thin line) and absorption without contribution of the ChlD1 (thin line), implying localization of the triplet state at ChlD1 at 10 K.

