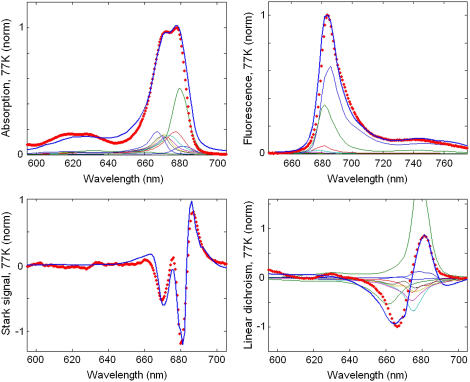
FIGURE 2.
Simultaneous fit of the 77 K spectra of isolated PSII-RC. Points show the experimental data, including OD, FL, and LD spectra (45) and Stark spectrum (26). Solid lines are calculated spectra, where the linear spectra, i.e., OD, FL, and LD are shown together with contributions from the individual exciton states (thin lines). The calculated spectra correspond to a primary charge separation within the special pair, i.e., CT = 

