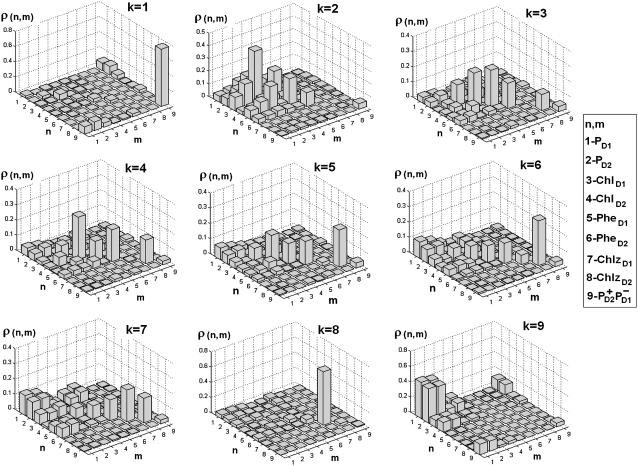
FIGURE 5.
Density matrix for the exciton states from k = 1 to k = 9 averaged over disorder. Bars show the density matrix elements ρ(n,m) in the site representation, where n and m number the eight pigments and CT state in the following order: 1-PD1; 2-PD2; 3-ChlD1; 4-ChlD2; 5-PheD1; 6-PheD2; 7-ChlzD1; 8-ChlzD2; and 9-

