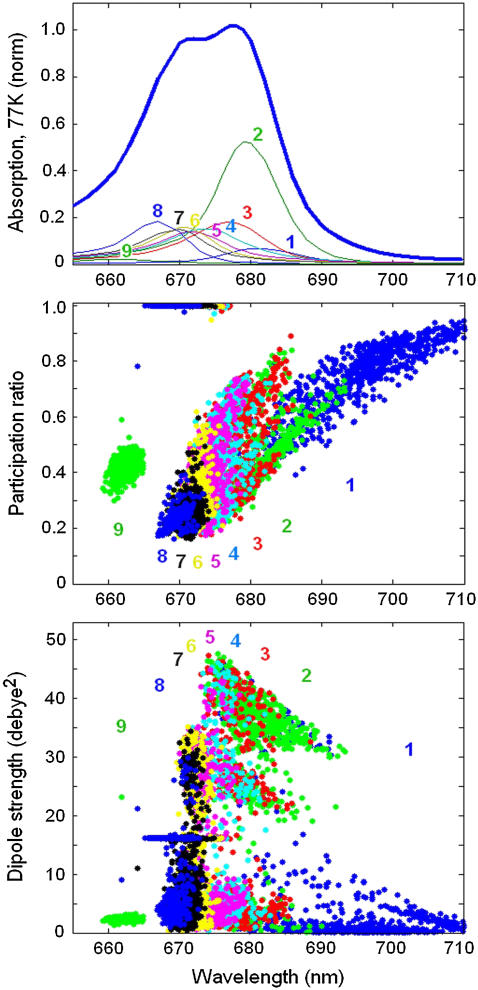
FIGURE 6.
Participation ratio (PR) and dipole strength of the exciton states as a function of the ZPL position calculated for 2500 realizations of the disorder. (Top panel) OD spectrum averaged over disorder (the same as in Fig. 2). The exciton components from k = 1 to k = 9 are labeled by numbers from 1 to 9 and shown by different colors. (Middle panel) PR values for 2500 realizations. PR values for different exciton states are shown by the same colors and have the same labels as exciton components of the OD spectrum. (Bottom panel) The same as in middle panel, but for the dipole strength of the exciton levels.

