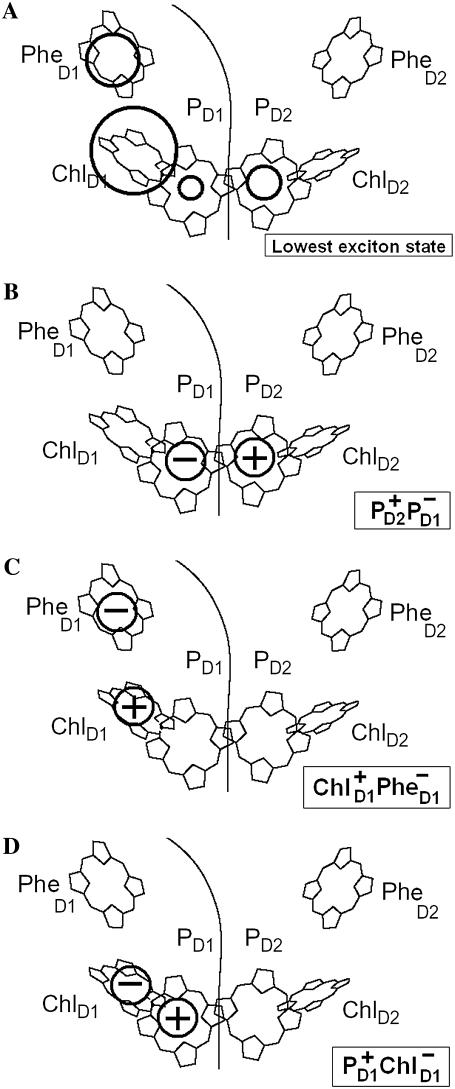
FIGURE 7.
The structure of the lowest exciton state that initiates charge separation, and possible configurations of the first CT state. (A) Circles show the pigments that are coherently mixed in a lowest exciton state. The area under the circle is proportional to population of the corresponding site. (B–D) Circles show a localization of the electron and hole in the CT states (i.e.,  and
and  ) that can be coupled to the lowest exciton state.

