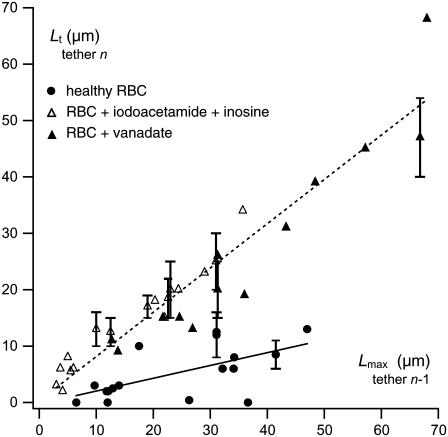
FIGURE 5.
Correlation between maximum tether length Lmax at cycle n − 1 and regime transition length Lt at cycle n as defined on Fig. 4 a for ATP-depleted/inhibited RBCs compared to healthy RBCs. Each data point corresponds to a pair of successive extrusions. In a few cases, the transition between the two regimes is softer than usual so that the length Lt cannot be defined precisely. In these cases, an error bar is added, representing this imprecision. ATP-depleted/inhibited data corresponds to 30 extrusion pairs obtained on 11 different cells and healthy RBCs data corresponds to 17 extrusion pairs obtained on 11 different cells. ATP-depleted/inhibited cells data are fitted with a dotted line of slope 0.79 ± 0.05, healthy cells data are fitted with a solid line of slope 0.23 ± 0.07. These fits mean that Lt and Lmax are significantly closer to each other but also more correlated for ATP-depleted/inhibited RBCs than for healthy RBCs.

