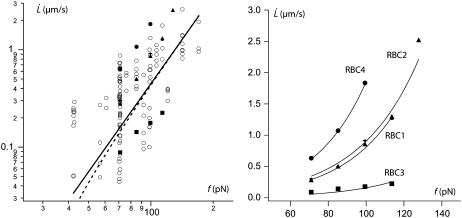
FIGURE 9.
Membrane permeation model versus experiments. (Left) Log plot of  data for all RBCs. (In black) Four individual RBCs shown on the right. Data are fitted with Eq. 21 (solid line) or Eq. 20 with f0 = 25 pN (dotted line). (Right) Linear plot of
  for four individual RBCs. Data are fitted with Eq. 20 with f0 = 25 pN.

