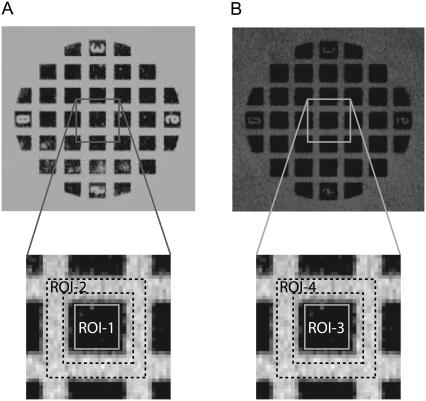
FIGURE 2.
Fluorescent images are shown for the slide after separation of the stamp. (A) Image of the Cy3 fluorescent signal of a spot after separation. (B) The same spot after binding of fluorescent-streptavidin to the free biotin. Dark squares correspond to the contact area where the balances have ruptured. Cy3START intensity and AF647START intensity have been derived from ROI-1 and ROI-3, respectively. Cy3REM intensity and AF647REM intensity have been derived from ROI-3 and ROI-4 and correspond to the grid around one contact area.

