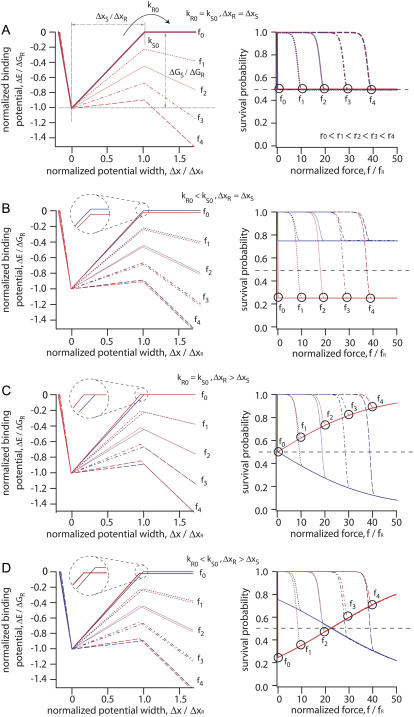
FIGURE 4.
Influence of the shape of triangular binding potentials for two bonds in series. The two binding potentials of the reference (blue) and the sample (red) bond are plotted on left. The differences in potential width and depth are magnified in the inserts. The resulting survival probabilities of the two bonds are plotted on the right side. The loading rates are r0 = 0 pN/s, r1 = 4 × 10⁻⁹ pN/s, r2 = 1.5 × 10⁻⁴ pN/s, r3 = 4 pN/s, and r4 = 1 × 10⁵ pN/s. The applied forces are f0 = 0 pN, f1 = 10 × fR, f2 = 20 × fR, f3 = 30 × fR, and f4 = 40 × fR with fR = kBT/ΔxR = 1.48 pN. (A) Perfectly symmetric molecular balance with identical potential width ΔxR,S = 2.8 nm and natural dissociation rates kR0,S0 = 2.82 × 10⁻¹⁴ s−1 . Black circles indicate the survival probability for the sample bond (red curves) for a given loading rate r0,1,2,3,4 and rupture force f0,1,2,3,4. (B) Asymmetry in potential depth, which corresponds to an asymmetry in kR0,S0 for a molecular balance with identical ΔxR,S but different kS0 = 8.46 × 10⁻¹⁴ s−1. The survival probability of the sample bonds indicated by the black circles is the same for different loading rates r0,1,2,3,4 and rupture forces f0,1,2,3,4. (C) Asymmetry in ΔxR,S with identical kR0,S0 but different ΔxS = 2.66 nm. The survival probability of the sample bonds, indicated by the black circles, rises with higher loading rates and rupture forces. (D) Mixed asymmetry with differences in kR0,S0 (kR0 = 2.82 × 10⁻¹⁴ s−1, kS0 = 8.46 × 10⁻¹⁴ s−1) and ΔxR,S (ΔxR = 2.8 nm, ΔxS = 2.66 nm). The sample bonds (red curve) have a lower survival probability than the reference bonds (blue curve) for low loading rates but rises with higher loading rates and rupture forces. The crossover occurs at a rate of rc = 9 × 10⁻⁴ pN/s.

