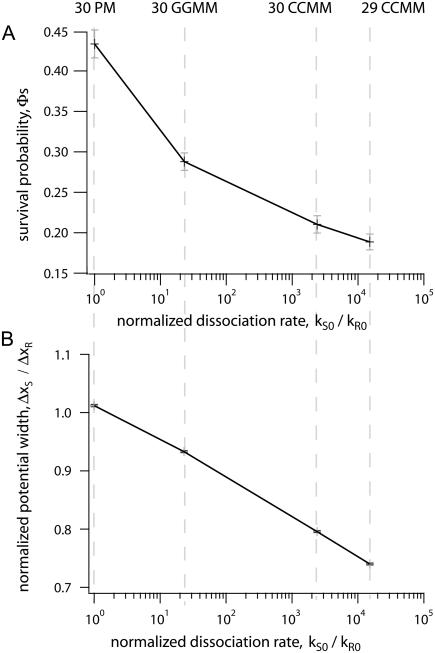
FIGURE 5.
Combined data from different experiments (light shaded bars) and simulations (solid line) on a 30-mer PM, 30-mer GG MM, 30-mer CC MM, and a 29-mer CC MM. (A) Survival property of the sample duplex ΦS plotted as a function of normalized dissociation rate kS0/kR0 on a log scale. (B) Calculated normalized potential width of the sample duplex ΔxS/ΔxR is plotted as a function of the corresponding normalized dissociation rate of the sample duplex kS0/kR0 that matches the survival probabilities in panel A. The pulling velocity was v = 5 nm/s, resulting in a loading rate of 37 pN/s at a rupture force of 48 pN.

