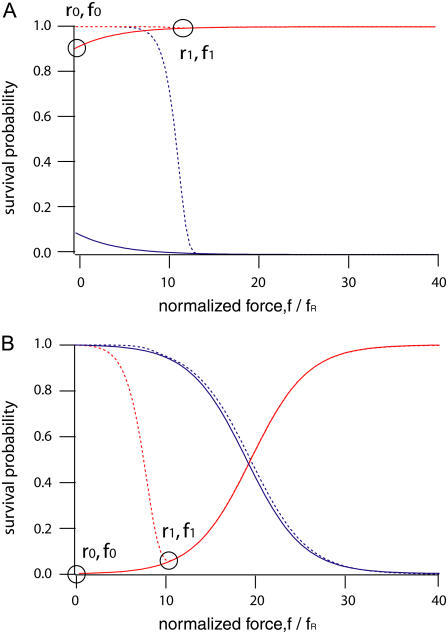
FIGURE 6.
Simulation of possible AFM experiments using two bonds in series. The reference bond is a 15-bp DNA duplex (blue), which was immobilized by (A) streptavidin/biotin (red) and (B) anti-digoxigenin/digoxigenin (red). Black circles indicate survival probability of the immobilization tag at f1 = 23 pN and r1 = 37 pN/s (dotted curves). The black circle on the solid line indicates survival probabilities at zero force (f0) and loading rate (r0). Reference: kR0 = 3.16 × 10⁻⁵ s−1 and ΔxR = 1.75 nm for 15 bp DNA (17). Sample: (A) kS0 = 3.71 × 10⁻⁶ s−1 and ΔxS = 1.31 nm for streptavidin/biotin (41). (B) kS0 = 0.015 s−1 and ΔxS = 1.15 nm for anti-digoxigenin/digoxigenin (16).

