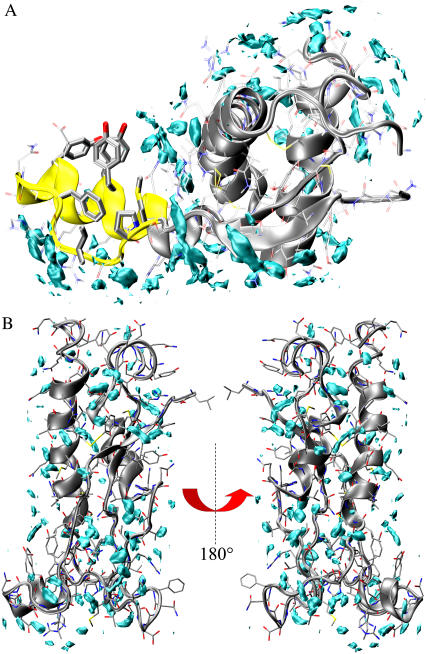
FIGURE 4.
Solvent density maps of the B6 and B3. The maps have been calculated from 50-ns MD trajectories at 300 K. (A) B6 MD hydration sites. The cyan level curves encompass region at high water density and are assumed to be the molecular dynamics hydration sites. Yellow ribbons locate the position of the dry surface (top of the fragment). (B) B3 hydration sites. The protein is rotated by 180° around a vertical axis in the two panels.

